Index of Industrial Production

Monday, June 1, 2015

Index of Industrial Production

See the chart of  IIP  along with various sectors
  • The Eight Core Industries comprise nearly 38 % of the weight of items included in the Index of Industrial Production (IIP).
  • The different sector has corresponding weight 
  • SectorWeight
    Coal4.379
    Crude Oil5.216
    Natural Gas1.708
    Refinery Products5.939
    Fertilizers1.254
    Steel6.684
    Cement2.406
    Electricity10.316
    Overall Index37.903

Read more...

Option Strategy : Covered Call

Friday, May 30, 2014

Covered Call


where an investor holds a long position in an asset and writes (sells) call options on that same asset in an attempt to generate increased income from the asset. 


This is often employed when an investor has a short-term neutral view on the asset and for this reason hold the asset long and simultaneously have a short position via the option to generate income from the option premium.


For example, let's say I own shares of the HINDALCO and like its long-term prospects as well but feel in the shorter term the stock will likely trade relatively flat, perhaps within a few Rs up and down of its current price of, say, 150. If you sell a call option on HINDALCO for 160 Rs, you earn the premium from the option sale but cap your upside. One of three scenarios is going to play out:


  • HINDALCO shares trade flat (below the 160 Rs strike price) - the option will expire worthless and you keep the premium from the option. In this case, by using the buy-write strategy you have successfully outperformed the stock.

  • HINDALCO shares fall - the option expires worthless, you keep the premium, and again you outperform the stock.

  • HINDALCO shares rise above 160 - the option is exercised, and your upside is capped at 160 RS, plus the option premium. In this case, if the stock price goes higher than 160 Rs, plus the premium, your buy-write strategy has underperformed the HINDALCO shares.
1 lot of HINDALCO has 2000 shares ( which approximately translates into 2000 X 150 =  3 lakh Rs  investment). almost all of the lot of different stocks is in the same range. Now lets see how near month price is for different strike price of HINDALCO 
=====================
Strike price     Premium 
150                  8.55
152.5               7.15
155                  6.25
157.5               5.40
160                  4.50
=====================
At strike price of 160, which is OUT-OF-THE-MONEY, call option can be relatively safely sold and premium of 4.5 Rs, which translates into  4.5 X 2000 = 9000 Rs , from an investment of 3 lakh, which translates into 3 % monthly return (36 % annual return  Quite decent return !!!!) 

A more sophisticated investor can use future in place of stocks to implement the same strategy, but the risk involved and skill requirement is quite high. 

Source : Wikipedia


This strategy is best used when the investor would like to generate income off a long position while the market is moving sideways. It allows an investor/writer to continue a buy-and-hold strategy to make money off a stock which is currently inactive in gains. 

The investor/writer must correctly guess that the stock won't make any gains within the time frame of the option; this is best done by writing an out-of-the-money option

A covered call doesn't have as much potential for reward as other types of options, thus the risk is also low.


Time Decay


The passage of time has a positive impact on this strategy, all other things being equal.  As expiration approaches, an option tends to converge very fast on its intrinsic value, which for out-of-money calls is zero.

Main point of this strategy :
  1. It has limited profit potential.
  2. It has unlimited loss potential.
  3. Once the strategy is introduced, reduction in volatility is beneficial for this strategy.

A note of caution

As long as the short call position remains open, the investor isn't free to sell the stock. It would leave the calls uncovered and expose the investor to unlimited risk by making it a naked call.


Read more...

Qtstalker Indicators

Saturday, December 24, 2011

Here is some of my custom indicators in qtstalker :
---------------------------------------------------------------
1. Constriction in Bollinger-band:

This indicator quantifies price movement with respect to overall range.
A higher value indicates a volatile movement in price.
Price movement within 5-15 %  can be considered as normal.
A very lower range bound  price movement for some days generally lead to a price breakouts which can be  in either direction.
Direction can be anticipated using other indicators.

Here is the code:   Its a custom indicator , so select   CUS in indicator select list.
Paste the below code in CUS indicator window.
----------------------------------------------------------------

INCLUDECUS(BBconstriction)
Bol_up :=TALIB(BBANDS, Close, 10, 2, 2, 1)
Bol_dn :=TALIB(BBANDS, Close, 10, 2, 2, 3)
SMA4 := TALIB(SMA,Close,4)
Range := UTIL(SUB,Bol_up,Bol_dn)
Inprcnt :=UTIL(DIV,Range,SMA4)

Then in Plot tab select , Inprcnt and choose color for display.
-------------------------------------------------------------------

2.  SMA crossover 
------------------------------------------------------------------

INCLUDECUS(smacrossover)
SMA5 :=TALIB(SMA,Close,5)
SMA8 :=TALIB(SMA,Close,8)


In PLOT tab select  these TWO variables   SMA5  and SMA8  with different color

---------------------------------------------------------------
There are so many indicators available to choose from the list and there combinations 
can be even more in number and in efficacy too.


The code for these indicator can be directly used to construct custom screeners.
So along with indicators, screeners can be constructed on every combination.

--------------------------------------------------------------
3. Negative volume Index (NVI)

(Left side of    :=    is variable name which user can choose by self.)

VOL1 :=VOL(NVI)
VAR1 :=TALIB(SMA,VOL1,20)

select these variable in PLOT  tab  with right choice of color
---------------------------------------------------------------
4. Positive volume index (PVI)

VOL2 :=VOL(PVI)
VAR2:=TALIB(SMA,VOL2,60)

------------------------------------------------------------
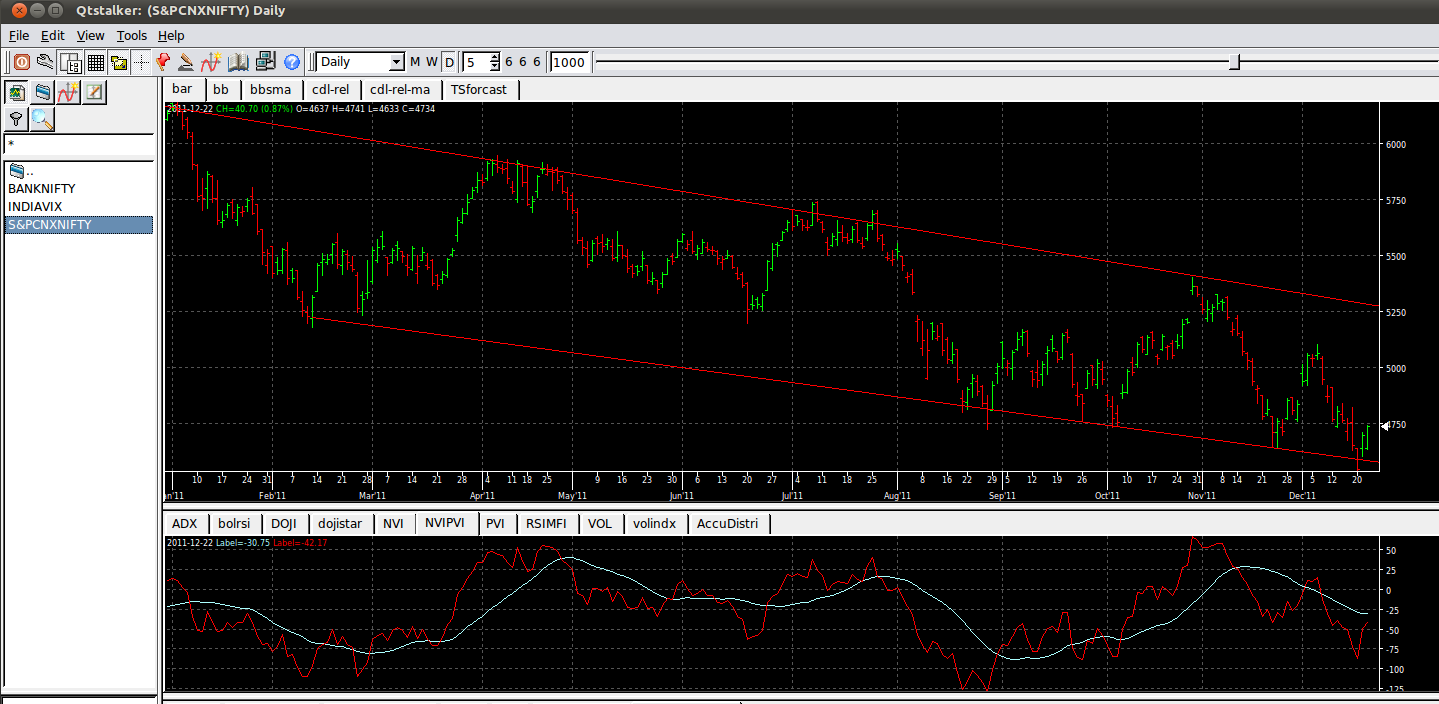
5. combining NVI AND PVI  in one 

INCLUDECUS(NVIplusPVI)
VOL1 :=VOL(NVI)
VAR1 :=TALIB(SMA,VOL1,60)
DIFF1 :=UTIL(SUB,VOL1,VAR1)
VOL2 :=VOL(PVI)
VAR2:=TALIB(SMA,VOL2,60)
DIFF2 :=UTIL(SUB,VOL2,VAR2)
VAR3 :=UTIL(ADD,DIFF1,DIFF2)
VAR4 :=TALIB(SMA,VAR3,40)

VAR3 and VAR4  can be plotted to predict the long term view of stock.

see this indicator working along with NIFTY 50 INDEX with above parameters.

NVI+PVI along with its 40 period moving average in lower TAB


--------------------------------------------------------------

These are some of the indicators which I use to get the direction of stock.
I can create any custom indicator on qtstalker given the algorithm for same within its framework.
I hope this series on qtstalker will continue as time passes.

Any feedback and comment will be highly appreciated.


Read more...

Qtstalker: A robust trade charting/analysis software in linux

Wednesday, December 21, 2011


Below text is directly taken from sourceforge website for qtstalker
I think its potential is unknown to many. I am using it with limited success for my trading activities. I will share some of my indicators and screeners which i designed using it. 

I am hoping to make a community for it .so the people out there who are using it can share there techniques to make a strong user community.

Qtstalker is a user friendly Technical Analysis package for GNU/Linux (and hence other Unix-like systems). Similar to commercial wares such as Metastock, Supercharts and Tradestation. Keeps to a lean, simple design for speed, portability, and low resource usage. Because it uses a plugin model, Qtstalker can easily be extended.
Qtstalker is 100% free software, distributed under the terms of the GNU GPL. An active development community is continually adding new features. We appreciate your input towards creating a world-class GNU/Linux TA package.

Features

  • A point-and-click object-oriented graphical user interface.
  • Chart types include line, bar and candlestick.
  • Customizable colors. Logarithmic and linear arithmetic scaling. Scale to screen.
  • Indicators plugins include MACD, MAs, Bollinger Bands, RSI, and dozens more. Provides access to the TA-Lib library of common functions.
  • A simple scripting facility to create custom indicators. This powerfully enables combination of different plots in one indicator and combining of other indicators and calculations.
  • A special indicator "ExScript" enables external scripts to pass indicator data in.
  • An "Indicator Summary" tool shows a table of all indicator parameters from all active indicators. It also writes the data to XML output for use by external programs.
  • Chart drawing objects: trendlines, buy/sell arrows, horizontal and vertical lines, fibonacci retracement lines, text and cycles.
  • Quote plugins download data from online sources such as Yahoo, CME, NYBOT.
  • Data import plugins for plain-text CSV files.
  • The "Plugin" architecture for quotes and indicators enables easy future extensibility.
  • Minute, daily, weekly and monthly chart compression options.
  • Various data classes to support for investment types such as stocks, futures, indices, ratios and spreads.
  • A back testing function allowing indicator performance tests using actual trading data.
  • A very basic portfolio manager. Good for tracking open positions. (Suggestions welcome.)
  • A Scanner that can scan the qtstalker database for charts that meet a user defined criteria.
  • A paper trading mode enabling users to practice trading without risking capital.

============================================================
MY Qtstalker screen:


I am fascinated with its library of TA indicator ( more than 150, supplied by TALIB ) which can be used with combination in custom indicators.

It has well written documentation and intuitive help for every thing. 

It has plugins for Yahoo data import and csv format (can be customized) 

My system is Dual-boot( windows7 & Ubuntu 11.04). For downloading the EOD data (nse stocks) and intraday data I use Datadownloder (volumedigger.com) .

For US stocks I have to just update it in qtstalker window itself. ( demerit : for Indian stock data data is 2 day old , means you will get Monday data on Wednesday and for Index you won't get volume data). I download NSE data from Datadownloader which take data from NSE website itself so data is in very good faith.

I am still looking like datadownloder software on ubuntu so that I dont have to do switching between linux and window.


Read more...

Back to TOP